Objectives
-
Know that radiant temperature impacts human health and thermal comfort
-
Identify the local climate zone
-
Draw or obtain an aerial view of a city sidewalk where they are going to be making observations
-
Conduct a temperature investigation by using a globe thermometer to measure the radiant temperatures along a block of their choice and see how temperatures change
-
Draw conclusions based on their observations to determine if there are areas where it is consistently or extremely hot
-
Identify areas where greenery or trees could be added to reduce temperatures, i.e., area is consistently hot and infrastructure could be modified to support greenery
Materials
Key Questions
-
Where is it consistently hot?
-
Where is it consistently cooler?
-
What is the max temperature you have observed?
-
Where did it feel cooler or hotter? Did it match your temperature observations?
-
Were the surfaces around you hotter or cooler in the areas with higher temperature recorded?
-
Do you think there is a space where cooling it down with greenery or a tree would help? What would make your block more comfortable during the heat of the day?
-
If you were to plant a tree to add shade, which tree would you choose? Why?
What To Do
Part 1: Identify your local climate zone
A scientist who studies the climate in and around cities is an urban climatologist. They research how atmospheric conditions and patterns impact urban areas and vice versa. In their work measuring urban temperatures and making recommendations for action, urban climatologists classify neighbourhoods into their local climate zone (LCZ). A local climate zone is an area that has consistent surface properties and land cover, and each LCZ can have unique air temperature patterns. The local climate zone you are in can affect how comfortable you feel outside.
1) Using the table on your worksheet and the following image, identify your local climate zone.
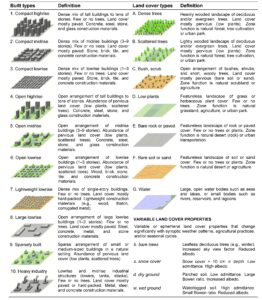
Click on the image above to see a larger version. Local Climate Zones (Stewart & Oke, 2012)
In addition to the temperatures you may record, the local climate zone you are in can impact how feasible adding trees or greenery is. If you are in LCZ 1, a compact highrise area, it may be harder to add trees given the amount of concrete or space in between buildings than if you are in LCZ 9, a sparsely built area. However, the temperatures experienced in these different LCZs may be vastly different and the importance of adding trees would be reversed – where it would be more impactful to human health and thermal comfort in the compact highrise.
2) Before moving on, answer the following question: For your local climate zone, how much space is there to add trees? A lot? A little? Are there other surfaces where greenery could be added like a patch of grass, walls where ivy could go, or a flat roof nearby?
Note down the possible areas. These are important areas for you to keep in mind as you explore the temperatures along your chosen block.
Part 2: Temperature Observations
Let’s see how hot your block can get!
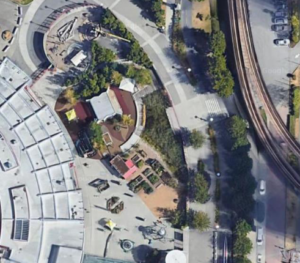
1) Print out an aerial view of your block and paste it on your worksheet. If you are feeling creative, you can draw your block! If you draw it, make sure you note down infrastructure changes; where is it paved or grass, where are the trees?
2) If you haven’t already, make your globe thermometer.
3) Choose a hot day to make observations. Record the weather and conditions outside. Take your worksheet, thermometer, timer, and pencil outside and make some observations. Explore and make observations across the whole area, don’t just stick in one spot. If you are moving from a very sunny spot to a shady location, make sure you give your thermometer enough time to adjust!
4) If you want to get even more advanced, once you have your observations, calculate the mean radiant temperatures using this resource. Globe thermometers measure what is called globe temperature.When should you make temperature observations?
Temperature observations ideally should be done multiple times, during the same day or across different days, in the same areas. It is recommended to choose a hotter day to try out this activity to really explore if temperatures are getting too hot for human health and well-being.
Part 3: Draw Conclusions
Take a look at your temperature observation map and look at the local climate zone you have identified. Reflect on your exploration and answer the key questions above.
Do you think there is a space where cooling it down with greenery or a tree would help? What would make your block more comfortable during the heat of the day?
Extensions
-
If you have a front yard, see if you can plant a tree that will provide shade on the sidewalk in front of your house. Use the My Tree app or work with your neighbourhood garden centre or arborist to choose the right tree to plant for your environment.
-
Want to plant trees with others? Join a community tree planting event during National Forest Week or for Arbour Day.
-
To make sure our cities are cooler for everyone, identify areas in your city where there is a lack of trees. Write a letter to your MP advocating for planting more street trees in these areas and communities of need.
-
Talk to your friends and family about how trees can reduce heat in our cities and how we need to provide equitable access to trees and heat protection for all.
Other Resources
Check out Vancouver’s Urban Forest Strategy and see what you can do to help!
Explore how the tree canopy and heat changes in your area and who is most vulnerable to extreme heat in your city.
The activity supports and is aligned with the UN SDG’s Climate Action and Sustainable Cities and Communities.
Thank you to our supporters
Science Spotlights and their companion activities are a GenAction initiative, presented by Odlum Brown, and supported by the Government of Canada.